Research
Plant evolution and biodiversity
biodiversity | repeated evolution | methods
Our research group studies plant evolution, morphological convergence, and biodiversity by integrating molecular, field, and herbarium data using statistical phylogenetics. We use sophisticated statistical methods to model the evolution of complex and understudied natural phenomena. We work on diverse plant lineages including monocots and ferns, and in regions including the American tropics, Hawai’i, and the Pacific Northwest. See our recent publications for examples of the results of our research.
What processes drive the accumulation and maintenance of biodiversity?

Our lab studies the processes driving the uneven spatial and temporal distribution of biodiversity across the globe, with a particular interest in the Tropical Andes and Hawai'i. We use integrative taxonomic tools to first understand and categorize units of biodiversity and then use model-based statistical phylogenetics to estimate the processes driving the evolution and movement of taxa.
Past and ongoing research in this area has asked how the uplift of the Andes influenced diversification and biogeography in Bomarea Mirb. (Alstroemeriaceae), a petaloid monocot characteristic of tropical Andean montane ecosystems. Bomarea is distributed from Northern Chile and Argentina to Mexico but is most diverse in cloud forests of the central and northern Andes. The genus is known for its showy flowers and striking variation in inflorescence architecture, primarily climbing habit (with erect species tending to live in higher altitude environments), and its well-developed and varied underground morphology. In collaboration with Fernando Alzate (professor at the Universidad de Antioquia in Medellín, Colombia), we are beginning a taxonomic revision of Bomarea Mirb., with recent field and herbarium work in Colombia, Peru, and Bolivia.

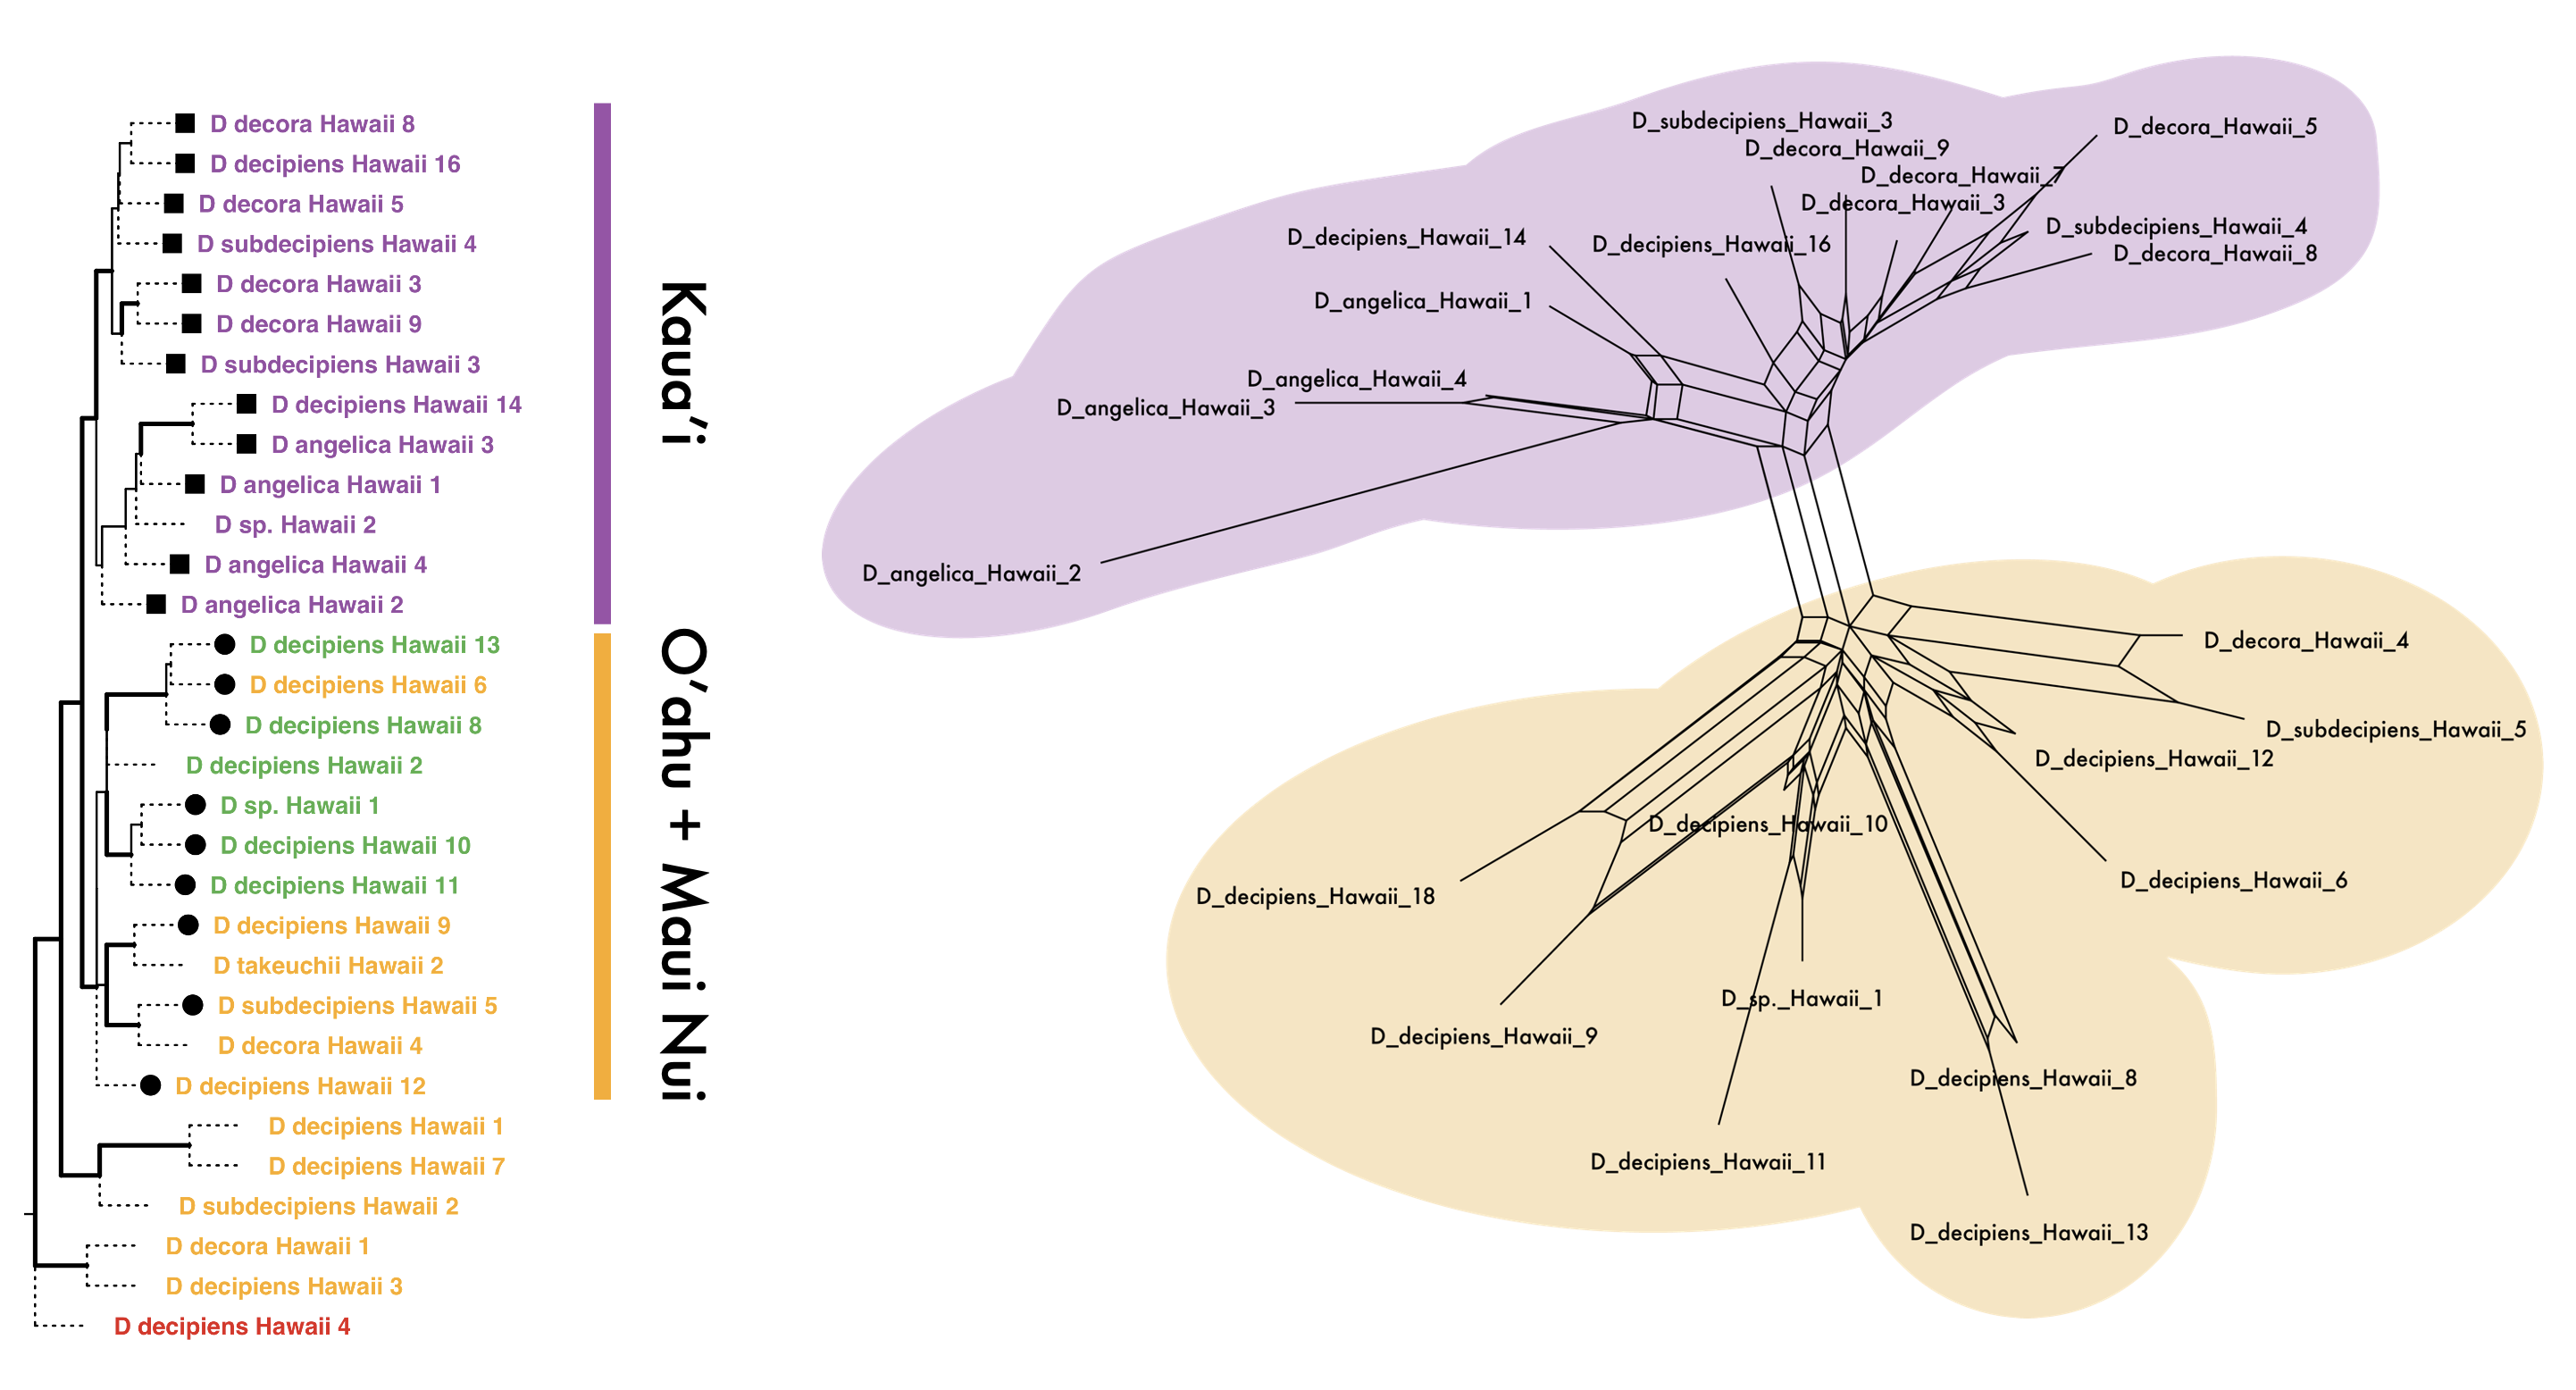
We are also interested in the factors driving differential outcomes following long distance dispersal, using the Hawaiian pteridophytes as a model for such processes. For example, we are investigating the dispersal, establishment, and radiation of Hawaiian dryland ferns, especially Doryopteris (Cheilanthoideae). We are integrating polyploid-aware phylogenetics, population genetics, and climatic niche modeling to better understand species boundaries and drivers of evolution is this group.
How do "repeated" morphologies evolve?

When the same macromorphological trait evolves multiple times, is it produced via shared genomic and anatomical mechanisms? Repeated phenotypic can play out across broad evolutionary scales, such as the repeated evolution of underground storage organs across vascular plants, or within more recently-diverged lineages, such as the repeated evolution of a non-climbing growth habit in Bomarea. Such examples of replicated evolution allow us to test the degree to which stochasticity vs. determinism drives evolutionary outcomes, and to understand how evolutionary distance influences the replication process.
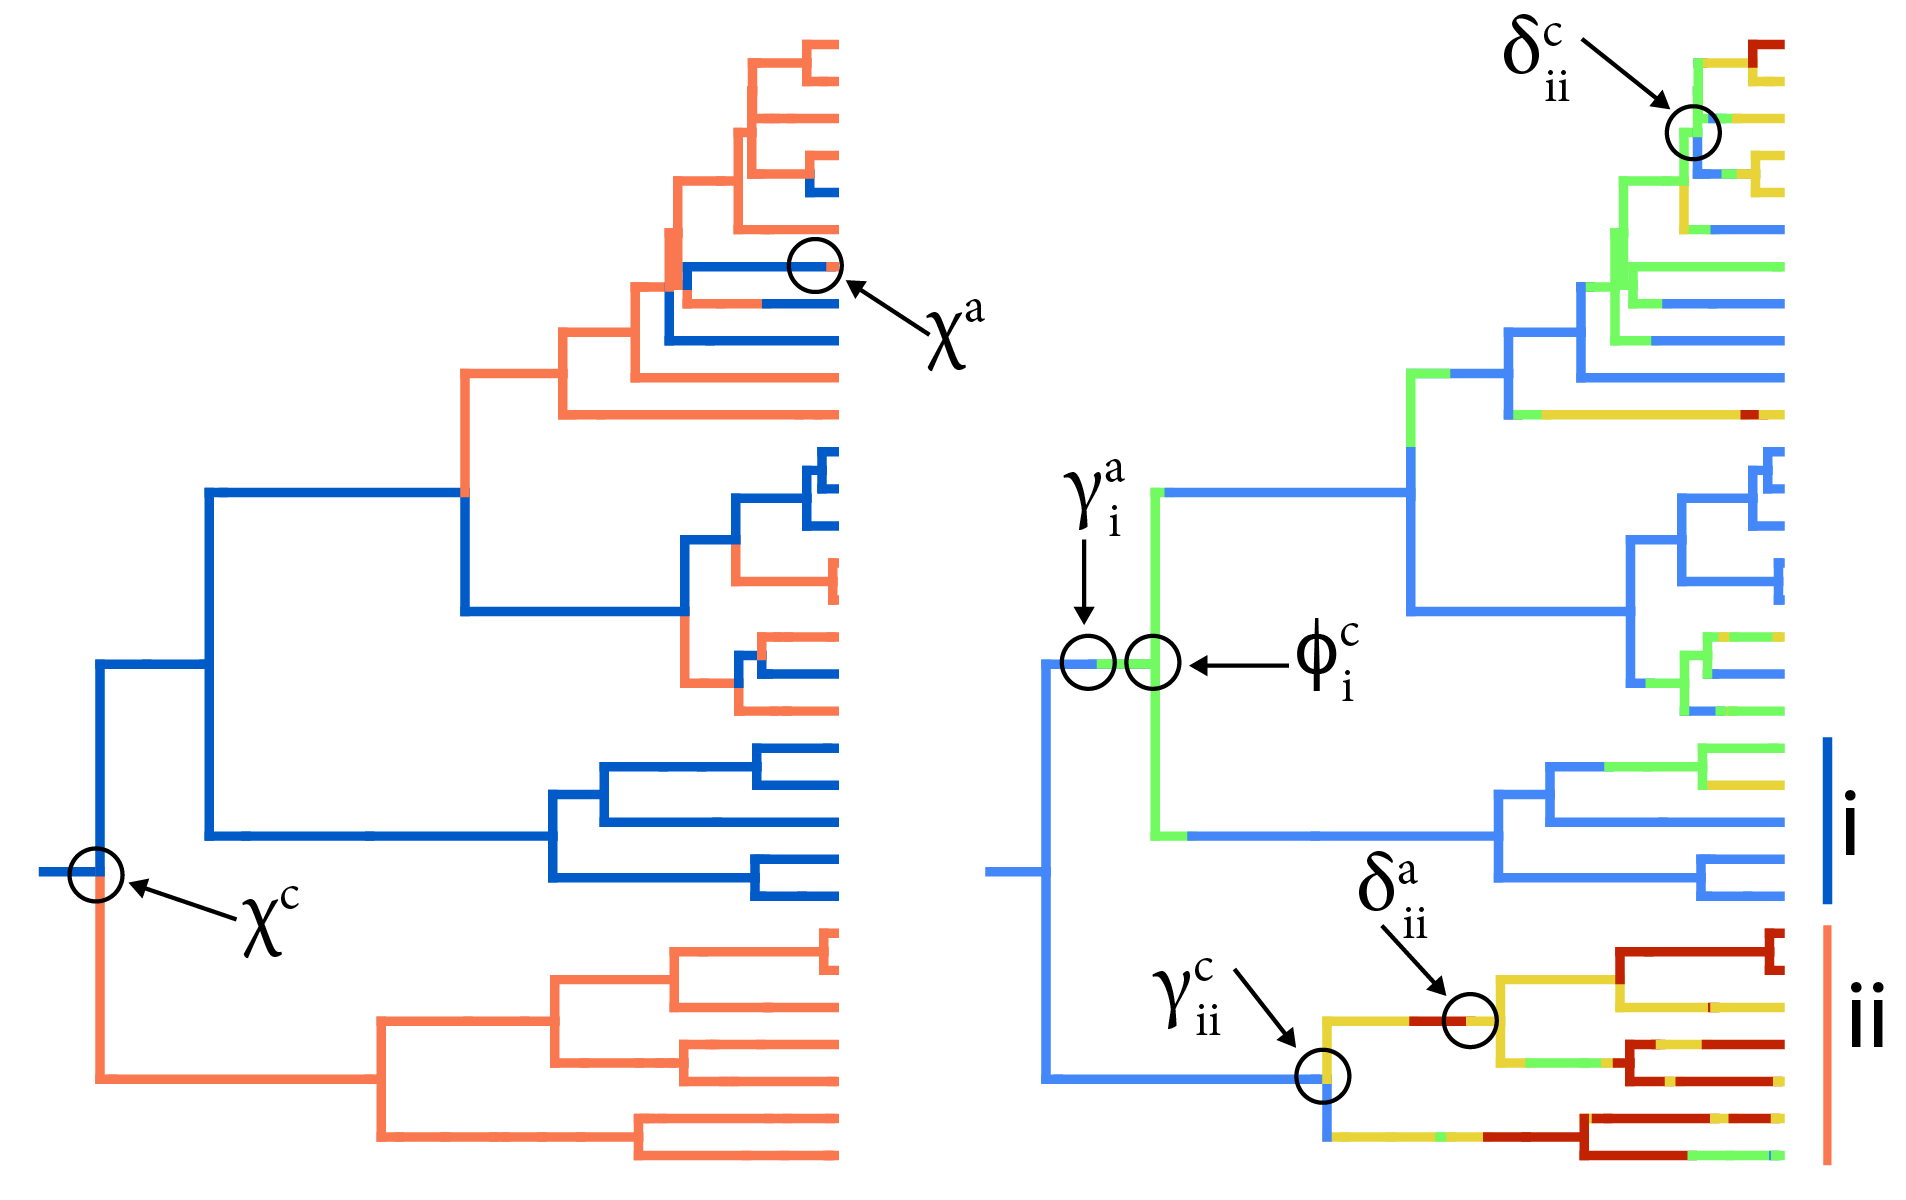
This work integrates diverse lines of work, including statistical phylogenetics to estimate when and where traits have evolved repeatedly across a phylogeny, evo-devo to understand the molecular and anatomical development of these traits, and genomics to model how traits are encoded and have evolved.
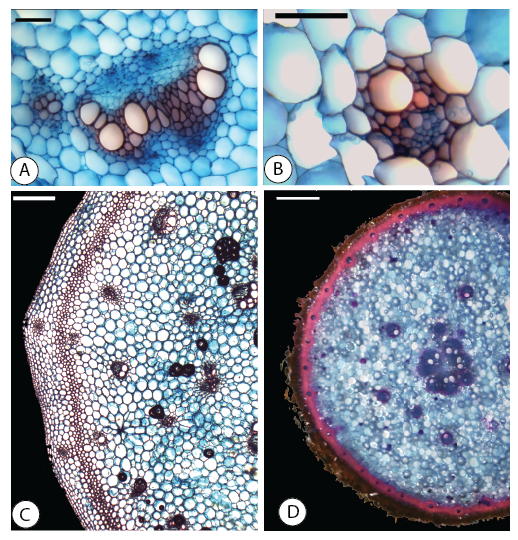
Ongoing projects include transcriptomic, genomic, and anatomic characterization of the evolution of the non-climbing habit in various Bomarea lineages, and the molecular evo-devo of above vs. belowground stems in Bomarea multiflora.
How can natural history knowledge improve our statistical methodological toolkit?

A common thread through the above-described research areas is the use of detailed natural history information, gathered through fieldwork and herbarium/natural history museum examination, to inform more appropriate and realistic statistical models. Much of our work uses model-based statistical phylogenetics, in a Bayesian framework. We innovate by pulling modular elements of existing models into novel combinations. Most of our work is done in the graphical modeling framework RevBayes. See our code page for more.